Mounting memory? This changes everything!
TL;DR
- Memory forensics is crucial for investigations, providing access to volatile data, like running processes and network connections.
- MemProcFS is a game-changer tool in memory forensics, allowing memory dumps to be mounted and browsed like file systems, simplifying the analysis of complex memory structures.
- Tools like Volatility (versions 2 and 3) with MemProcFS enhance forensic analysis by offering different strengths such as extensive plugin libraries and intuitive memory navigation.
- By mounting memory files, investigators can easily analyse suspicious processes (e.g., Excel launching malicious code) and track network connections to threats like ransomware groups.
- MemProcFS offers advanced features like memory timelines and registry browsing, making it a powerful tool for tracking system activity and investigating security breaches.
Introduction
In my last blog post we delved into the Volatility Framework. In this two-part series I want to highlight how memory forensics plays a crucial role in enhancing forensic investigations by providing access to volatile data that cannot be retrieved from storage devices like hard drives.
By analysing a system’s RAM, investigators can uncover crucial evidence such as running processes, network connections, encryption keys, and user activity that occurred in real-time before the system was powered off. This allows for the recovery of hidden or deleted data, detection of malware, and identification of unauthorized access, thereby complementing traditional forensic techniques and providing a more comprehensive understanding of cyber incidents and criminal activities.
Whilst this blog does not intend to go into any detail into some of the most popular tools available to analyse memory, nor a deep dive into analysis techniques it is intended to provide high level information about some significant enhances to memory forensics in the last few years and the difference in tooling. This also covers three memory forensic tools; many others are available.
Understanding Memory Structure
Before we delve into understanding different ways to analyse memory, utilising forensic techniques, it’s a good idea to understand RAM structure.
RAM (Random Access Memory) is a type of volatile memory that temporarily stores data for quick access by a computer’s processor. The structure of RAM can be understood at different levels, from its physical arrangement to its internal organisation.
Here’s a breakdown of the structure of RAM:
- Physical structure
- Memory Chips: RAM is typically built using memory chips that are soldered onto a printed circuit board (PCB). These chips contain arrays of memory cells.
- DIMMs and SO-DIMMs: The PCB with memory chips is organised into modules. For desktops, these modules are called DIMMs (Dual Inline Memory Modules), and for laptops, they are SO-DIMMs (Small Outline DIMMs). Each module contains multiple memory chips.
- Memory cell
- Transistor and Capacitor: Each memory cell in a RAM chip is made up of a transistor and a capacitor. The capacitor holds a charge (representing data as a bit, 0 or 1), while the transistor acts as a switch to read or write the bit.
- Row and Column Addressing: Memory cells are organised in a grid of rows and columns. Each cell is accessed by a unique address derived from its row and column.
- Banks and ranks
- Banks: A RAM module is divided into multiple banks, which are subsets of the memory that can be accessed independently. Modern RAM can have multiple banks that allow for better performance by enabling interleaving (accessing multiple banks simultaneously).
- Ranks: A rank refers to a set of memory chips that can be accessed at the same time. A RAM module might have one or more ranks, allowing for more data to be accessed simultaneously.
- Bus interface
- Data Bus: The data bus connects the RAM to the CPU and other components, allowing data to be transferred in and out of memory. The width of the data bus (e.g., 64-bit) determines how much data can be transferred in one operation.
- Address Bus: The address bus carries the addresses of the memory locations that are being accessed. The width of the address bus determines how much memory can be addressed.
- Control logic
- Memory Controller: The memory controller manages the flow of data between the CPU and RAM. It handles operations such as reading, writing, refreshing, and timing.
- Timing Mechanisms: RAM has specific timing mechanisms (e.g., CAS latency) that dictate how long it takes for data to be read or written after a request is made.
- DRAM vs. SRAM
- DRAM (Dynamic RAM): The most common type of RAM, where each memory cell is made of a capacitor and a transistor. It needs to be refreshed frequently to retain data.
- SRAM (Static RAM): Faster and more expensive than DRAM, SRAM uses multiple transistors for each memory cell and does not need to be refreshed. It is used for cache memory.
- Logical organisation
- Memory Array: RAM is logically organised into an array of memory locations, each identified by a unique address. The size of the array depends on the capacity of the RAM (e.g., 8 GB RAM has more memory locations than 4 GB RAM).
- Word Size: The word size (e.g., 8-bit, 16-bit, 32-bit) represents the number of bits that can be accessed or processed at a time.
- Power and refresh
- Volatile Memory: RAM is volatile, meaning it loses its data when the power is turned off. In DRAM, data must be refreshed regularly to retain it, due to the leakage of charge in capacitors.
- Power Supply: RAM requires a stable power supply to maintain its operations, particularly for DRAM where periodic refresh cycles are needed.
Forensic analysis of RAM
For my forensic analysis lab, I have a Windows 10 VM with 8GB of RAM. During my analysis I will be walking though some of the different tools used to process and analyse the memory, looking at some of the limitations and benefits.
I have executed a malicious file that I created some years ago which has the hash value below, although for this analysis I have changed a number of things such as the IP it makes a GET request to:
b505a07e2c29d2ac37dc5fe55c26ccd62e838ca9a12fdb26c7b35b9b3b30982d
VirusTotal – File – b505a07e2c29d2ac37dc5fe55c26ccd62e838ca9a12fdb26c7b35b9b3b30982d
MemProcFS – The game changer?
MemProcFS was created by Ulf Frisk with the first release of v1.0 on github showing around 2018. Ulf Frisk is a well-known figure in the field of memory forensics and digital investigations. The tool was designed to provide a more accessible way to analyse memory dumps by presenting them as a file system-like structure.
That’s right, we can mount the memory file and browse it just like we can a disk image!
The main objective of MemProcFs is to offer a virtual file system view of memory, making it easier for forensic analysts to navigate and extract information. By representing memory structures such as processes, threads, and kernel objects as files and directories, MemProcFs simplifies the analysis process.
Let’s take a look at the head of help file of MemProcFs:
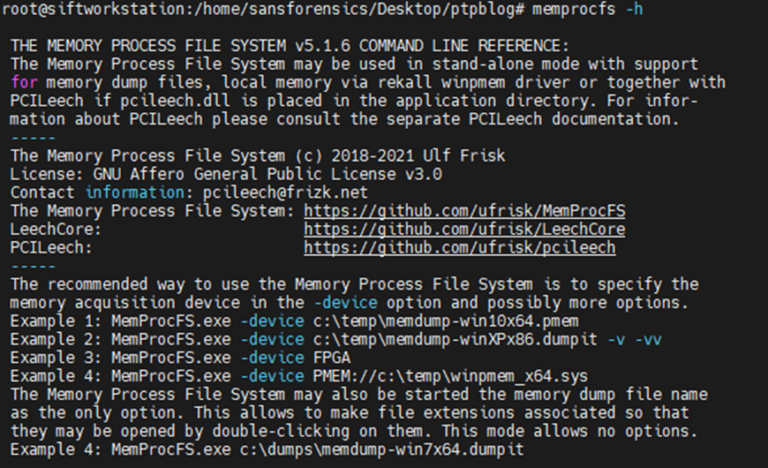
Image 1: Output from MemProcFs help page
I typically run the command with the forensic switch also which I will highlight the benefit of running at the end of this write up.

Image 1: Output from MemProcFs help page
I typically run the command with the forensic switch also which I will highlight the benefit of running at the end of this write up.
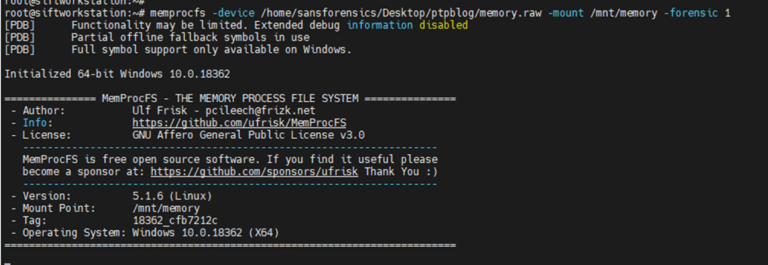
Image 3: Output from MemProcFs mount command
Inside the directory where I have mounted the memory file, I am presented with the below:

Image 4: Output from ls command on the mounted directory
Inside the forensic folder, we can see a progress_percentage.txt file, if I continue to open this file over time, I can see the progress % of the task which will complete at 100% (around 5 minutes).
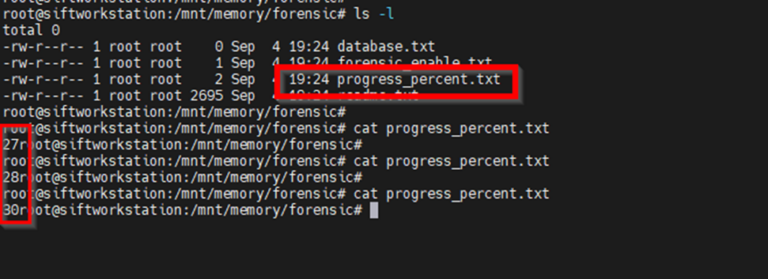
Image 5: Showing progress % of MemProcFS processing
Leaving this here for the moment I will go back a directory and analyse the network traffic – I will move over to MemProcFS in Windows instead as some on the analysis is a little more intuitive with explorer – which I’ll explain when analysing the registry hives.
Here I have mounted the memory file again and it has been allocated the M drive as a mount point:

Image 6: Mounting of the memory sample file with PowerShell
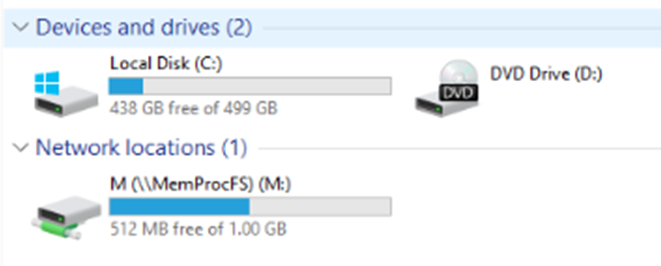
Image 7: Mount point of the memory sample file at M
Inside this mount point we have the same content as we did when analysing this in Linux:
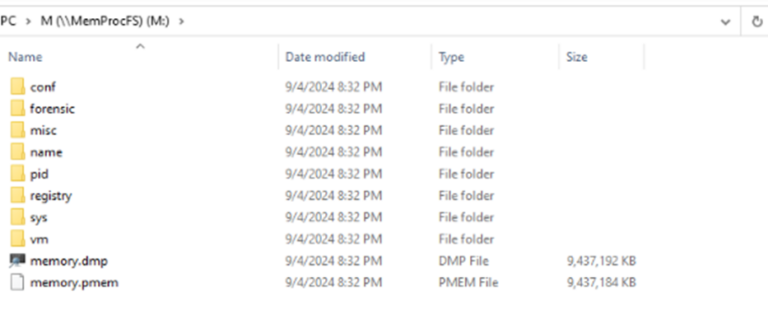
Image 8: Content of the mounted sample file in Windows
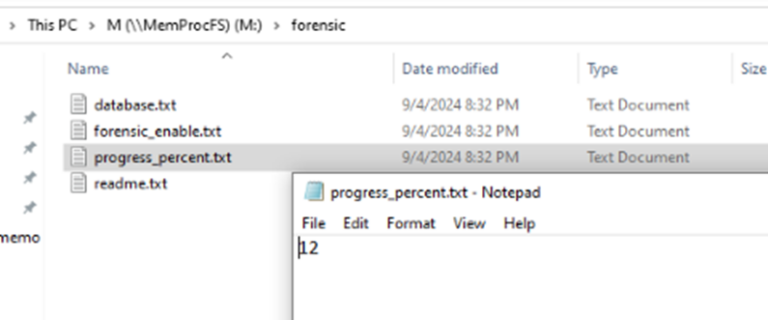
Image 9: MemProcFs % of processing in Windows
Analysing the netstat output I can see some suspicious connections.

Image 10: suspicious connections in netstat output of MemProcFS
Further analysis of the IP address leads me to the belief that the IP address 185.141.63{.}120 relates to the ransomware group “CONTI”.
The PID (process ID) is showing as 3920 so we can delve into that PID a little further later and we also see Excel was running at around same time.
Looking at the proc file matching up with the PID as observed in memory, we have the PID 3920 with a parent PID of 996 which is observed as svchost.exe.

Image 11: Proc file analysis showing PID and Parent PIDs
Now if we delve into the handles of the parent process 996 we observe Excel in the handles file with a PID 2708.
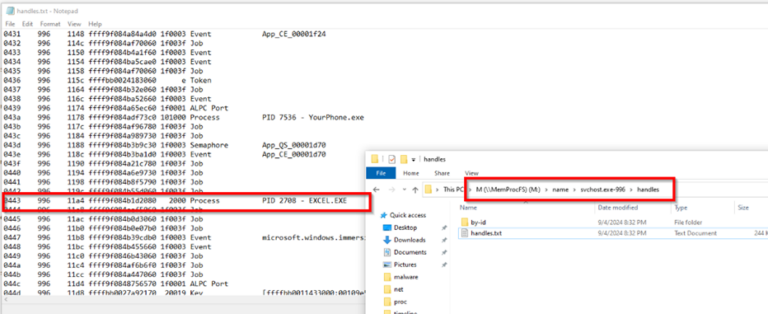
Image 12: Handles shown again Parent PID
In memory forensics, handles refer to references or pointers that the operating system provides to manage and interact with system resources, such as files, processes, registry keys, and objects like mutexes or events. These handles act as abstract identifiers that allow a process to access and manipulate the underlying resource without needing to know its physical memory address or other low-level details.
If we further examine the PID 2708 handles, we observe the Excel process. We can also identify name of the Excel file which triggered the handle in a couple of places.
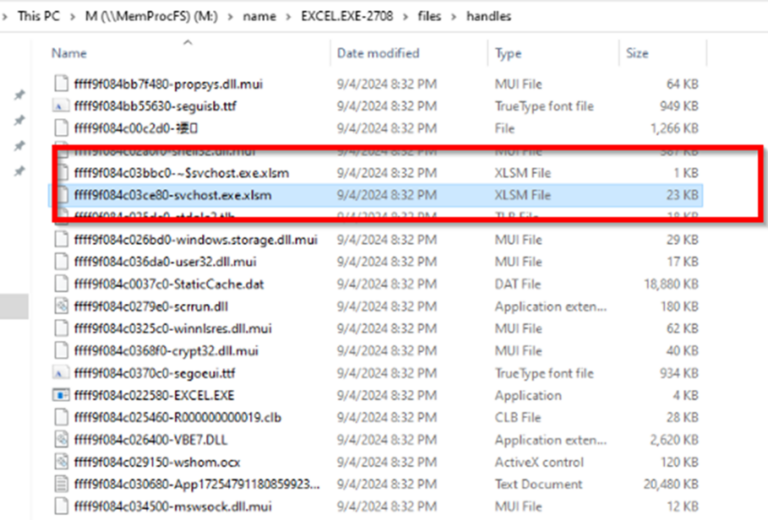
Image 13: File name listed in handles file of MemProcFs

Image 14: File name listed in handles file of MemProcFs
We can now tie this back to the Excel file and analyse this on disk for further examination.
Moving back to the forensic switch feature on the command, this really highlights the benefit of using MemProcFs.
Now that the progress_percentage.txt has completed to 100% , we have a bunch of data that MemprocFS has provided. We have the MFT as extracted from memory along with a few timelines to help us with our analysis.
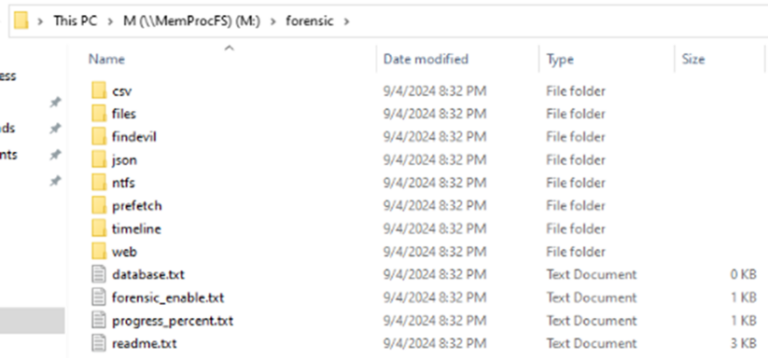
Image 15: Output of MemProcFs Forensic processing
This includes separate timelines plus a single joined super memory timeline to aid in analysis. These files are also available ready in CSV format as well as txt.
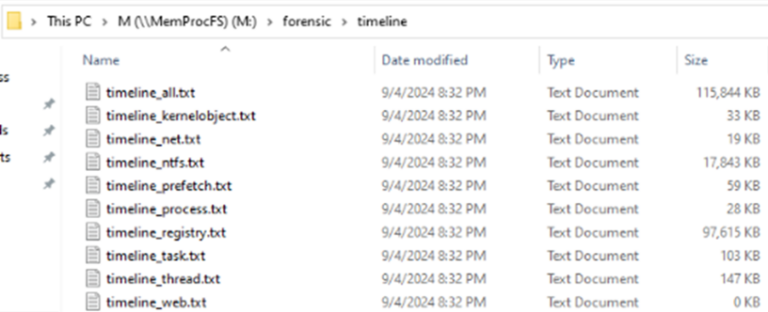
Image 16: Timeline outputs of MemProcFs Forensic processing
A sample of the timeline_all.txt is seen here where we can see the chain of events compiled for us into one simple to analyse file:
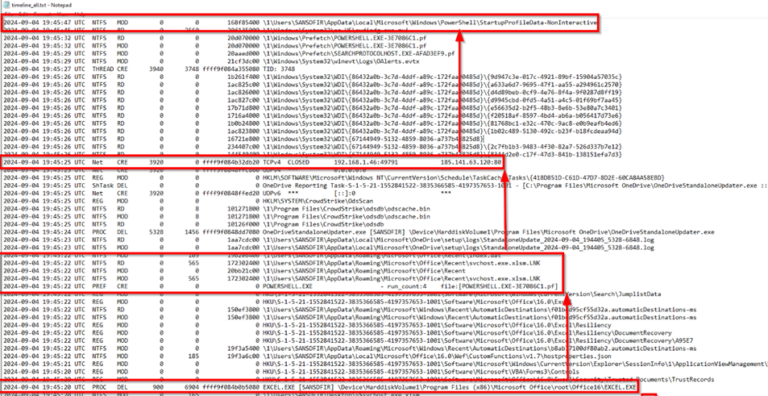
Image 17: Output of MemProcFs timeline all file
Finally, the reason I have switched over to Windows for this analysis is to browse the registry in an explorer view, just as if I was analysing them from a disk image:
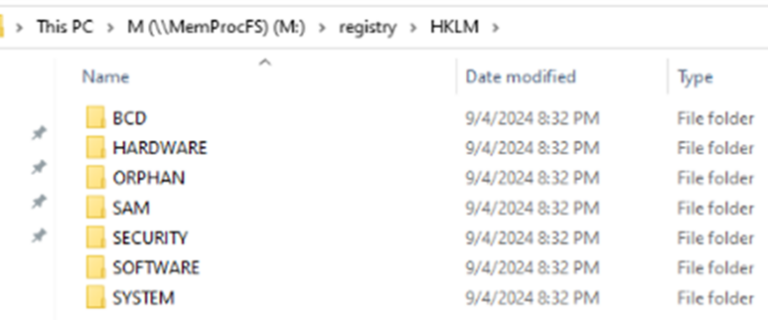
Image 18: Explorer view of hives – MemProcFs
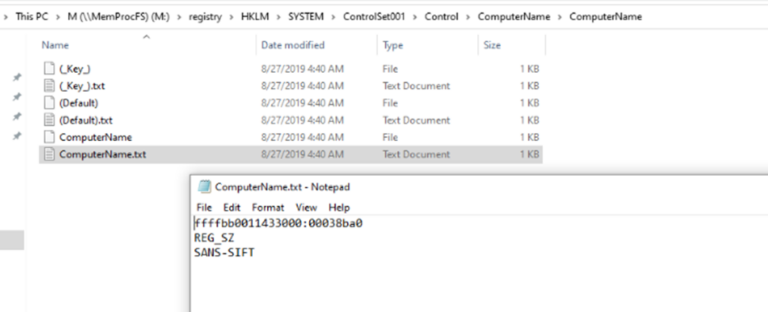
Image 19: Explorer view of HLMK – MemProcFs
Summary
Using Volatility 2, Volatility 3, and MemProcFs together in investigations can enhance the depth and accuracy of memory forensics. MemProcFs, being my current core tool of choice due to its intuitive file system-like interface, simplifies navigating and extracting memory artifacts, making complex memory structures more accessible.
By complementing MemProcFs with Volatility 2 and Volatility 3, we can leverage the extensive plugin library of Volatility 2 and the modern, symbol-based analysis of Volatility 3. This combined approach ensures comprehensive coverage across different operating systems and memory structures, allowing you to cross-verify findings and achieve more robust forensic results.











No Comments yet!